

My last post for my week in review and what's coming was erased when I attempted to add a new blog site for my other business. Lucky I had Updraftplus installed on my blog site which sends me a copy of my blog site twice per day, so I only lost the last post. Since it's Monday morning and the market is in what Marc Nicolas would say the "Danger Zone" I've done nothing but sit on my hands, so I'll re-review what was erased and go over last nights price action in the ES.
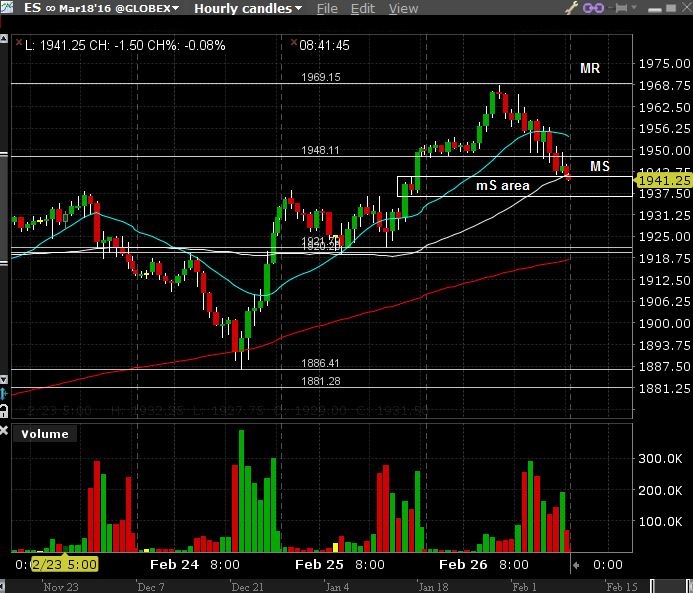
Friday the market sold off into the close taking out our new area of Major Support MS at the 1948 level on the hourly chart to end the week at 1941.24. The key level of support is the 1940 level seen on the Daily chart. I mentioned that if we can't stay above the 1940 level then I felt that we will retest the 1886 level. If we can stay above the 1940 level the ES has a great trading range all the way up to the 2000 level before the ES would find some resistance. Here is the ES hourly chart showing the move below our MS area of 1948...
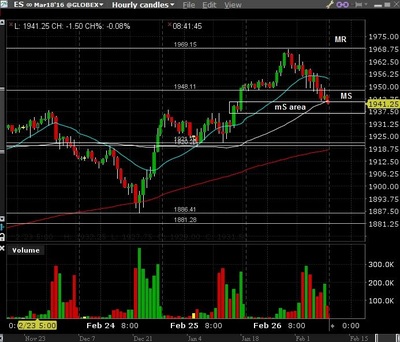
ES hourly 02272016 1
The Daily chart ended the week with a red topping tail which looks bearish, you can also see the mR area up in the 2000 area...
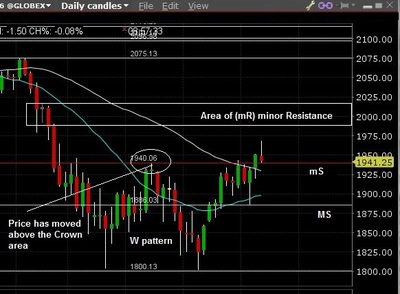
ES Daily 02272016

Here is the weekly closing with a wide body spinner type bar, note the 1981 mR level, this is where the Bears will attempt to take over when price moves into this area.
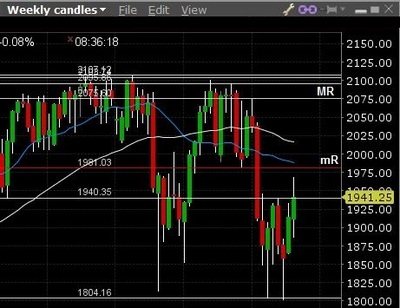
ES weekly 02272016

Overnight, the ES continued its move lower to finally find Support at the 1927 level before moving back up to where we are currently trading at the 1947 level, back above our key 1940 area on the Daily chart. Right now the market looks sideways from our 1969 high to our low of 1927. Currently I'm just sitting on my hands waiting to see which way this market is going to go...
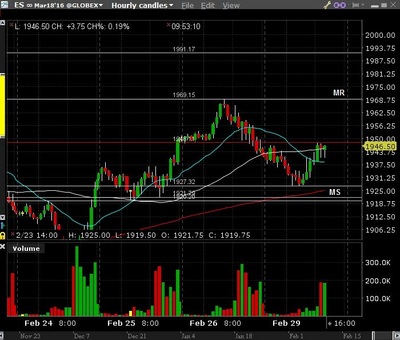
ES 02292016 am
