Even though the daily chart of the QQQ finished with a green bottoming tail and a COG the 15 minute chart of the Q’s does not look as bullish as the daily buy setup looks on the daily chart. Major resistance actually moved lower from 66.86 down to 66.70 and with the gap down today, we can move our major support down to the 66.25 area. Currently the Q’s are in a sideways motion drifting lower but the daily chart looks like we might trigger a daily buy which could be explosive. For Tuesday if we gap above the 66.86 area, I would look to take the first 5 minute buy in the QQQ with a longer target of 67.30 area. If we stay below the 66.86 area and start to move lower, I’d short the first 5 minute sell with a target of 66.25. Huge resistance area above but the daily chart looks really bullish, wait for the higher low in the market before going long if we open neutral.
Longs:
AKAM – Daily Buy Triggered
AMGN – Pivot I
CELG – Wide Range Bar
HOG – Daily Buy Watch
JDSU – Gap continuation
TOL – Break out
QQQ – Daily buy watch
Shorts:
CREE – Gap continuation
RIG – Climatic Watch
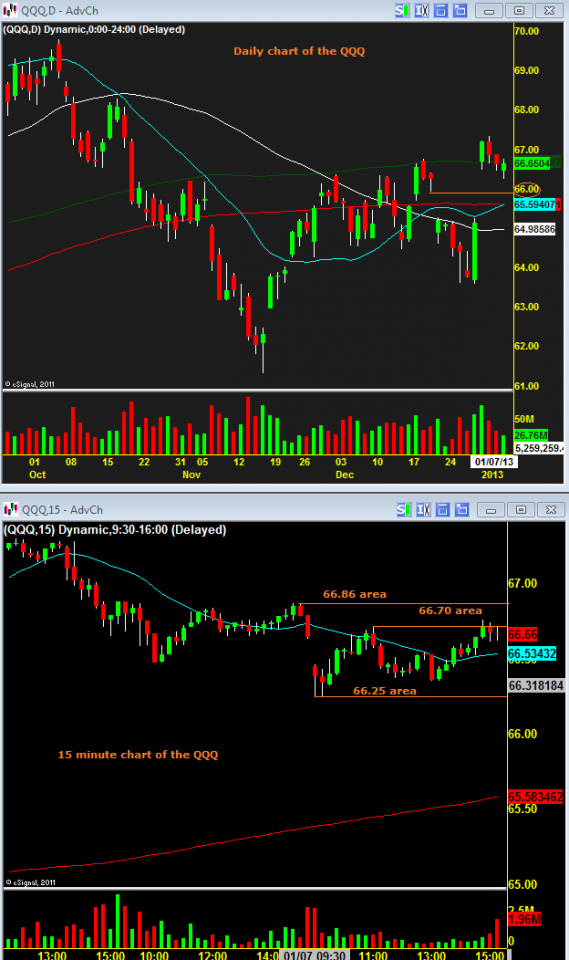
QQQ 01072013