

Since my last post, My last chart showed that I had put my net out again at the same location of my winning trade to short GBPUSD. Here is that chart again, click on chart to enlarge...

Same trade on again GBPUSD

Here is what the 4 hour chart looks like with all of my limit, stop loss, and Take profit orders placed...
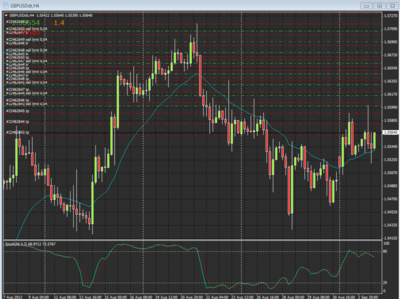
On again H4 chart GBPUSD

Here is what the daily looks like...

Daily GBPUSD 09032013

Here is the chart yesterday, Wednesday morning, 2 limit orders were hit short so I currently have 2 lots short in GBPUSD...

gbpusd update 09042013

By Wednesday afternoon my 3rd limit order was hit but I stopped out on my 1st limit order short. So the play is still on with 2 lots short...

2nd update GBPUSD 09042013

Here is this mornings update which shows how price was wiped by this mornings news. 1 lot went to take profit last night and 2 more lots where triggered short this morning as a result of news. Immediately, these 2 new lots went to their 40 pip take profit areas and now I'm down to my final lot with its take profit area on the horizon...

Update 3 GBPUSD 09052013

My trade ended mid morning today with a total of 6 of the 8 lots triggered short, 2 lots stopped out, and 4 lots went 40 pips each for profit. Net profit is 2 lots for 40 PIPS of profit 🙂