Yesterday I was looking for a continuation lower which just did not happen as the market just rocked the Bears as the Bulls took over taking out minor resistance mR 1956 and MR at 1969 to finally topping out at the 1985 level. We have a new mS area at 1969 which is being challenged as I write this. This level must hold for our possible new uptrend to continue on the 60 minute chart.

Click on chart to enlarge ES 03022016 mid day

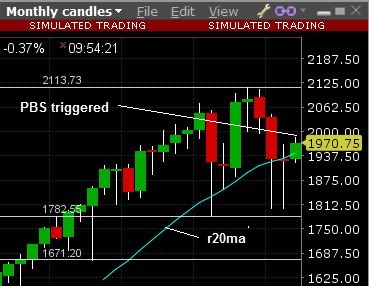
Interesting now is the conflict that we have between the Weekly and Monthly charts of the ES. Yesterday price hit the 1981 area of mR for the first time and I'm expecting them to sell this area hard, but on the monthly chart price made it above last weeks high triggering a PBS (Pristine Buy Setup) at the rising 20 ma. I believe if the buy setup fails on the monthly chart they're going to to sell this market hard, like in a panic!

EW weekly 03022016
Here is the monthly...