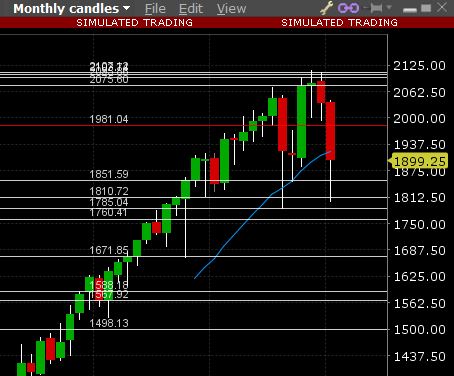
Since it's the weekend let's check out our larger time frames in the ES. The monthly uptrend is still intact, we would have to close below 1785 for the uptrend to end.
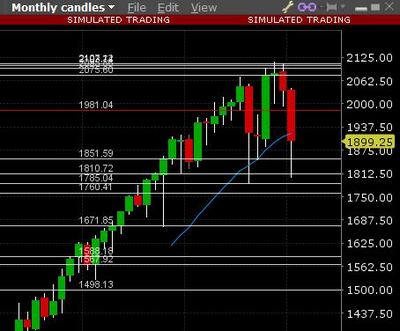
ES Monthly
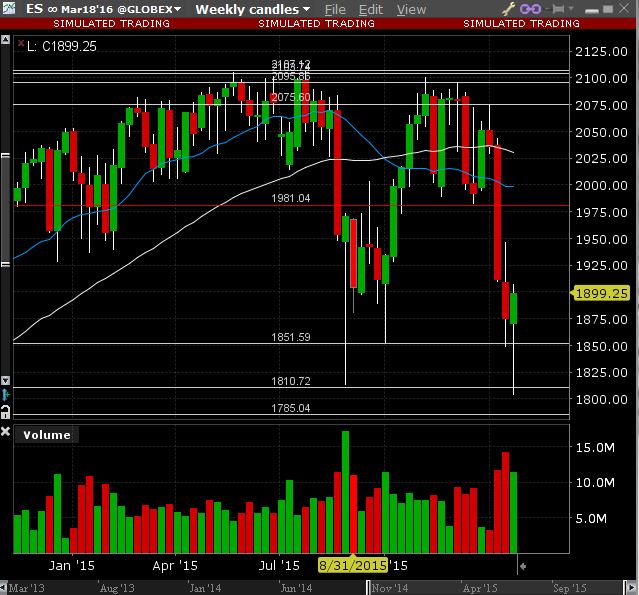
The weekly closed with a nice bottoming tail COG, looks bullish, but the weekly uptrend was broken in August 2015 and at best, we are sideways on the weekly time frame.
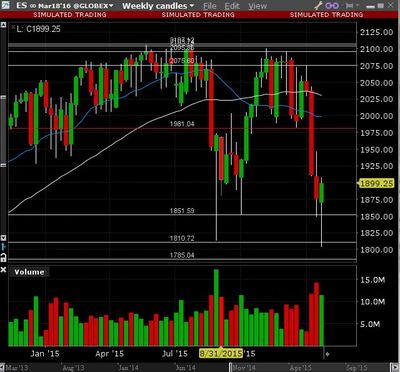
ES Weekly
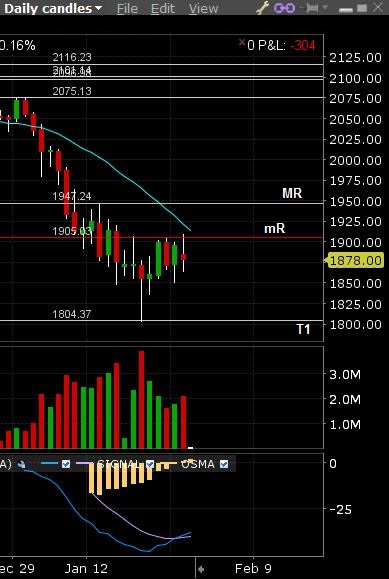
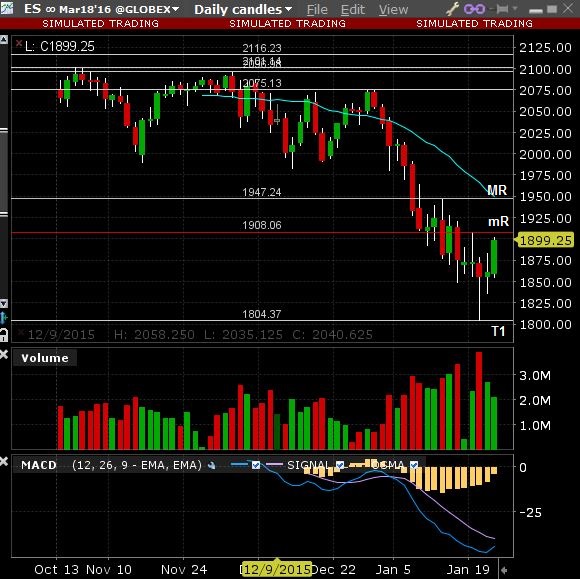
The Daily time frame is at the moment of truth where price is at mR and should bounce off of the 1908 area and head lower to make a new low if this downtrend is going to continue on the Daily time frame. Price action was bullish on Friday but I was bored watching the ES claw its way to the 1900 level to finally close at 1899.25. I did manage to sell the SPY 198/197 CCS for .16 cents expiring Feb 5th which might have been a little aggressive but price near the 1908 area is the right place to put this trade on. If price continues higher and blows through this 1908 area, I'll back ratio my spread to get net net long.
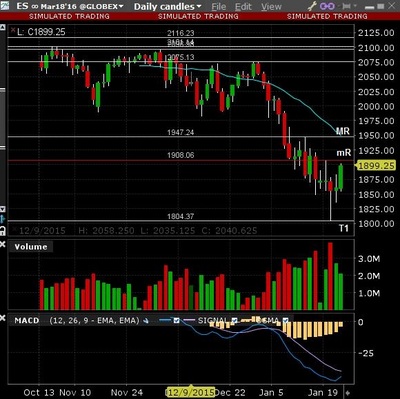
ES Daily
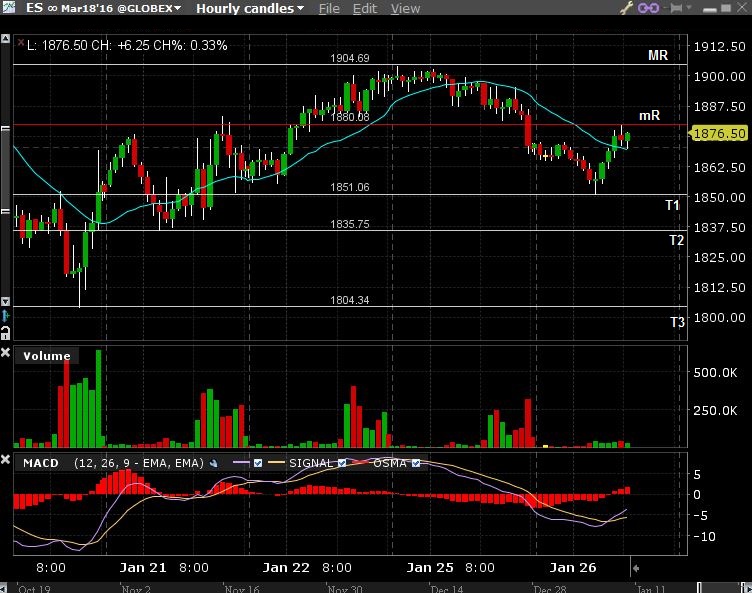
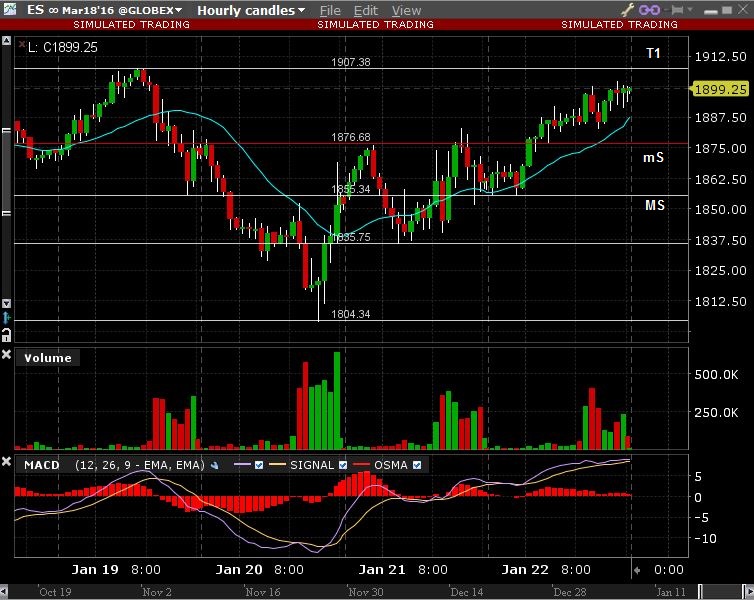
Last but not least is our hourly timeframe which currently is at odds with the Daily as price is currently in an uptrend. There was no pull back on Friday to retest the 1876 area of mS so I was never able to take a directional trade in the ES. I'll be looking for this play on Monday. It will be interesting to see if the Europeans will move price above the 1907-08 area or will they sell it to challenge the new uptrend on the 60 minute chart.

ES hourly